
Mollier's psychrometric chart
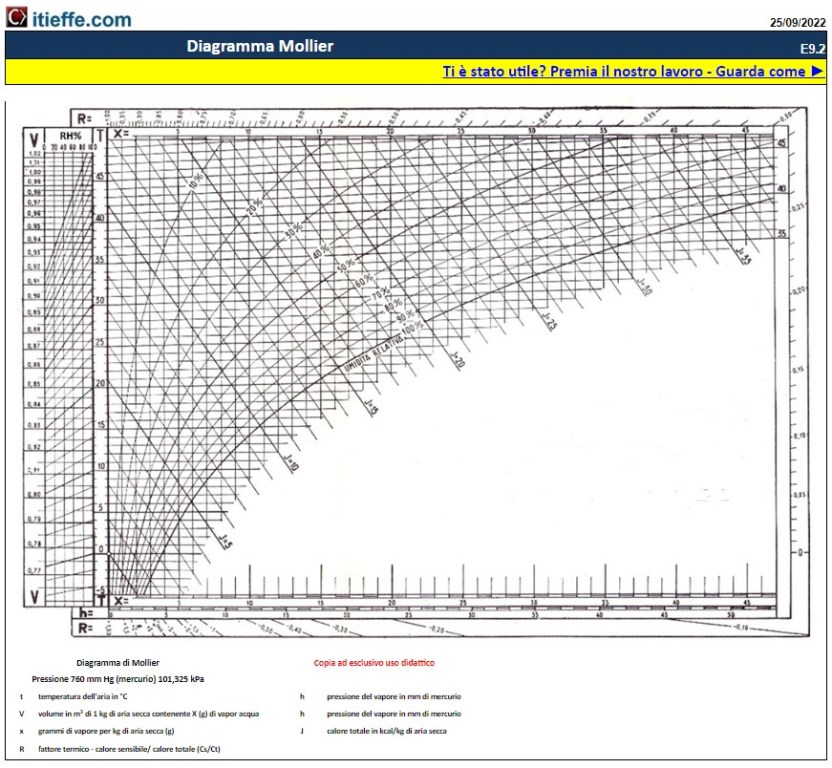
Mollier's psychrometric diagram for psychrometric calculations (humid air calculation) provided for educational use only.
The psychrometric chart is a fundamental tool in air conditioning, heating, ventilation and refrigeration engineering. Essential for analyzing and understanding the properties of moist air and for designing effective and efficient HVAC-R (Heating, Ventilation, Air Conditioning, and Refrigeration) systems, the psychrometric diagram is a crucial resource for engineers, technicians and industry professionals.
What it offers
This paper is proposed to offer a detailed and in-depth guide on this specific tool. The Mollier psychrometric chart is one of the recognized psychrometric charts in the HVAC-R industry. It was created to provide a clear and accurate representation of the properties of moist air, allowing operators to easily understand and analyze environmental conditions and air behavior in a wide range of applications.
Within this paper, you will find in-depth explanations of the components and lines of Mollier's psychrometric diagram.
Conclusions
Understanding the Mollier psychrometric diagram is essential to designing HVAC-R systems that deliver optimal room comfort, air quality, and energy efficiency. This paper aims to provide a complete indication on how to fully exploit this tool, thus contributing to improving engineering practices in the HVAC-R sector and promoting sustainable and cutting-edge solutions for air conditioning and environmental comfort.
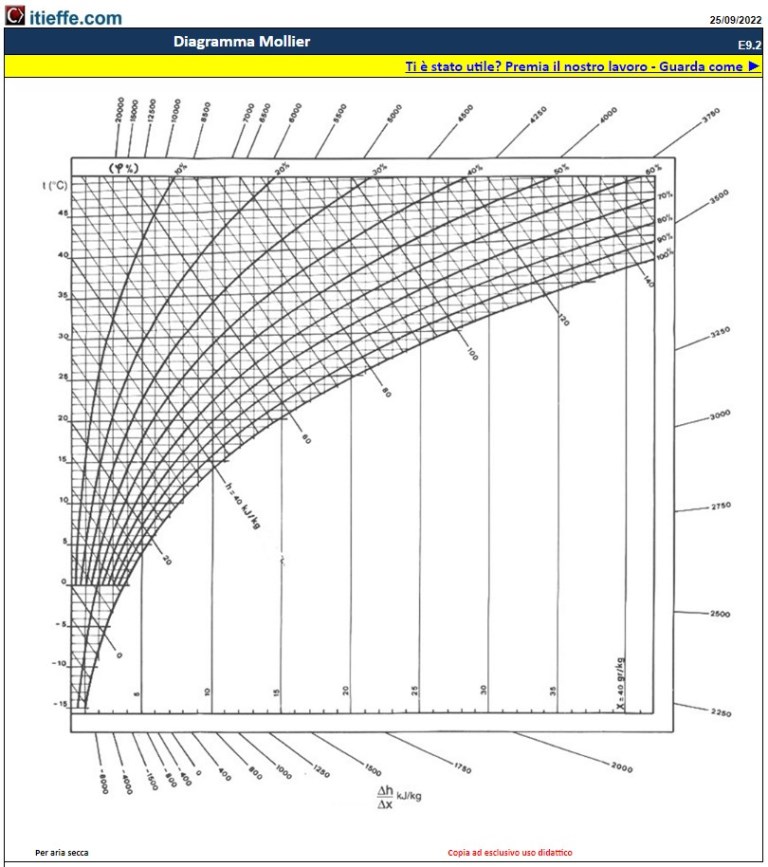
Mollier's psychrometric chart
Mollier's psychrometric diagram for psychrometric calculations (humid air calculation) provided for educational use only.
The Mollier diagram is a thermodynamic diagram that represents the enthalpy of a system (which can be a mixture or a chemical substance) as a function of other thermodynamic quantities. Examples of thermodynamic quantities indicated in the diagram can be the volume, temperature and pressure of the system.
If the ordinate axis of the diagram reports the enthalpy (h) and the abscissa axis reports the entropy (s), we speak more specifically of an enthalpy-entropy diagram or hs diagram.
The Mollier diagram is named after the Austrian physicist and engineer Richard Mollier, who first introduced it in 1906.
Particularly used is the Mollier diagram of the air-water mixture, which represents its enthalpy as a function of entropy, volume, pressure, temperature and vapor content, reporting enthalpy on the ordinate axis and on the 'abscissa axis entropy or steam title. This diagram is the European correspondent of the Anglo-American psychrometric diagram, as both contain identical information, but represented differently.
Mollier diagrams of the air-water mixture are often used for the design and analysis of power plants, steam turbines, compressors and refrigeration systems.
source Wikipedia
Other free programs of the same kind offered by itieffe ▼
- Air conditioning
- Air ducts
- Ventilation systems
- Autonomous air conditioners
- Psychrometric charts
- Air conditioning tables
- Air quality
- Conditioning diagrams & drawings
Mollier's psychrometric chart
The program below is free to use.
To access the reserved version (see below), full page and without advertising, you must be registered.
You can register now by clicking HERE
◄ Back