
Carrier's psychrometric chart
Carrier psychrometric diagram for psychrometric calculations (humid air calculation) provided for educational use only.
The psychrometric chart is a fundamental tool in air conditioning, heating, ventilation and refrigeration engineering. Essential for analyzing and understanding the properties of moist air and for designing effective and efficient HVAC-R (Heating, Ventilation, Air Conditioning, and Refrigeration) systems, the psychrometric diagram is a crucial resource for engineers, technicians and industry professionals.
What it offers
This paper is proposed to offer a detailed and in-depth guide on this specific tool. The Carrier Psychrometric Chart is one of the most widely used and recognized psychrometric charts in the HVAC-R industry. It was created to provide a clear and accurate representation of the properties of moist air, allowing operators to easily understand and analyze environmental conditions and air behavior in a wide range of applications.
Within this paper, you will find in-depth explanations of the components and lines of Carrier's psychrometric diagram.
Conclusions
Understanding Carrier's psychrometric chart is essential to designing HVAC-R systems that deliver optimal room comfort, air quality, and energy efficiency. This paper aims to provide a complete indication on how to fully exploit this tool, thus contributing to improving engineering practices in the HVAC-R sector and promoting sustainable and cutting-edge solutions for air conditioning and environmental comfort.
Carrier's psychrometric chart
Carrier psychrometric diagram for psychrometric calculations (humid air calculation) provided for educational use only.
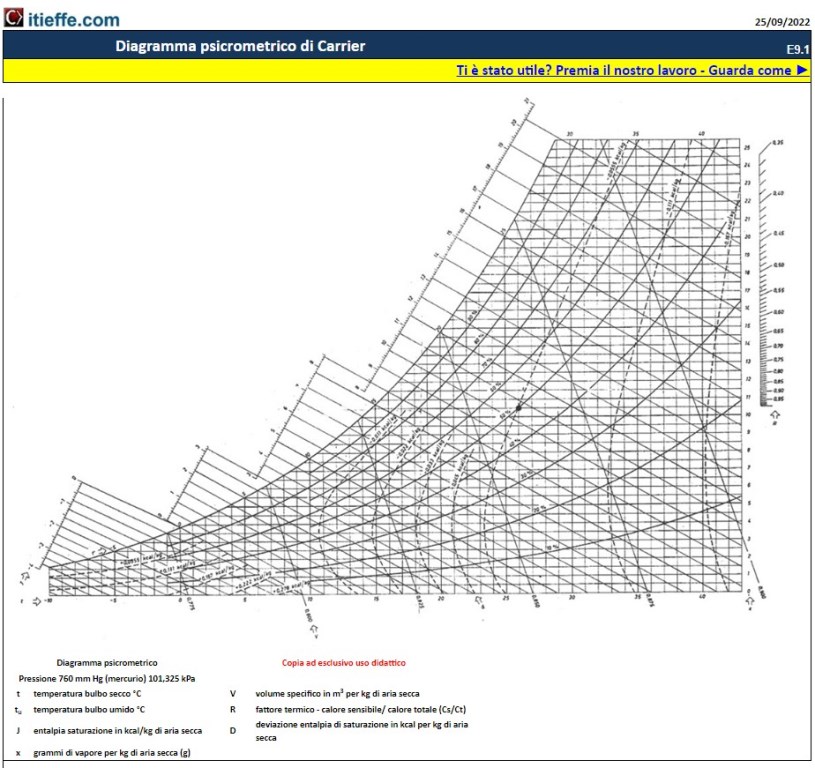
The Carrier diagram (also called psychrometric diagram or Grosvenor diagram) is used for determining the properties of a constant pressure water-air mixture.
We can consider the diagram as a graphical representation of the equations of state.
The versatility of the Carrier diagram lies in the fact that it is possible to determine all the physical quantities of interest from the knowledge of 3 independent quantities (or state variables), one of which is the pressure, set for each specific diagram.
It is possible to use the diagram to graphically estimate the characteristic quantities of the mixture following a thermodynamic transformation, provided that the transformation is isobaric and at the reference pressure of the diagram used.
The so-called can be found in the psychrometric chart saturation line, which separates the fog area (in which the system consists of air saturated with water and liquid water dispersed in it, in the form of very minute drops or aerosols) from the area consisting of unsaturated air (in which the system consists of a mixture of air and water vapor) .
The abscissa axis of the diagram corresponds to the null value of humidity, therefore it corresponds to the conditions of dry air.
In the unsaturated air zone, curves with constant humidity and oblique lines, called 'adiabatic cooling lines, which are at constant adiabatic saturation temperature, are drawn on the diagram.
Of these lines only the point of intersection with the saturation line is equilibrium, while the other points correspond to conditions of instability.
If the system under consideration is in a condition of temperature TV e absolute humidity Y (and relative humidity uR), represented by the point (TV, Y), in order to reach equilibrium, in adiabatic conditions the point in question will move upwards following the cooling line, until it reaches the point (TS , YS) having adiabatic saturation temperature TS and humidity YS, which is on the adiabatic saturation line.
In the case of the air-water system, the adiabatic saturation temperature is equal to wet bulb temperature TW extension.
Starting from the point (TV, Y) it is also possible to determine the dew point temperature (Tdew) by drawing the horizontal from the point until it meets the saturation line.
In addition to the aforementioned curves, the following can be represented on the Carrier diagram:
- the saturated volume curve
- the straight line relating to the specific volume of dry air
- the straight line of moist heat.
Starting from the temperature it is possible to obtain the value of the molar wet volume by raising the line of the specific volume of dry air a vertical segment up to the saturated volume curve, and then dividing this segment by a percentage equal to the molar fraction x of water.
source Wikipedia
Other free programs of the same kind offered by itieffe ▼
- Air conditioning
- Air ducts
- Ventilation systems
- Autonomous air conditioners
- Psychrometric charts
- Air conditioning tables
- Air quality
- Conditioning diagrams & drawings
Carrier's psychrometric chart
The program below is free to use.
To access the reserved version (see below), full page and without advertising, you must be registered.
You can register now by clicking HERE